Contents:
During the course of a larger cybercrime investigation regarding attack & exfiltration methodologies, Heimdal™ Security’s SOC team has discovered that although cyberattacks have increased in volume, the odds of success have dramatically decreased. In analyzing the trendlines pertaining to successful vs. unsuccessful cyber-aggressions in the context of volumetric inflation, Heimdal™ has aggregated data from all available detection grids (i.e. anti-ransomware encryption protection, antivirus, brute-force guardrails, DNS traffic analyzer, and email protection). In this article, we will take a closer look at the leverage telemetry and define a contextual relationship between volume increase and the plummeting cyberattack success rates.
Highlighting Pooled Data. Context Correlation.
In constructing this case, Heimdal™ has pooled six months-worth of detection data from five modules: Ransomware Encryption Protection, Next-Gen Antivirus, Brute-Force Analyzer, Threat Prevention – Endpoint + Network, and Email Security. Throughout the aforementioned six-months timeframe, 10,618,665 have been registered by Heimdal™ Security.
A subsequent breakdown of the attack by surface reveals that a staggering 71.8% (5,004,686) of the registered aggression has been carried out by email (i.e. phishing, spearphishing, Business Email Compromise, Vendor Email Compromise, CEO fraud, etc.). The values related to the remaining attack surfaces are as follows:
- Malicious Encryption Attempts – 4,200;
- Antivirus-related Infections – 346,955;
- Brute-Force (Attempts) – 1,090,561;
- DNS-delivered infection – 4,172,263.
For a broader understanding of this data and the result of Heimdal™’s evaluation, we must factor in additional statistics regarding attack success probability:
- Malicious Encryption Attempts: 1 in 10,000 attacks is successful.
- Antivirus-related infections: 1 in 200,000 attacks is successful.
- Brute-Force (Attempts): 1 in 100,000 attacks is successful.
- Attacks leveraging DNS: 1 in 1,000,000 attacks is successful.
Data-gathering efforts began on the 31st of May 2021, with a halt on the 31st of October 2021. MoM (month-over-month) volumetric variances are as follows:
- Malicious encryption attempts: 786% increase (reference timeframe: 31.05 – 31.10.2021).
- Antivirus-related Infections: 30% increase (reference timeframe: 31.05 – 31.10.2021)
- Brute-Force (Attempts): 7.2% increase (reference timeframe: 31.05 – 31.10.2021).
- DNS-delivered infection: 10% decrease (reference timeframe: 31.05 – 31.10.2021).
- Email attacks: 32.92% increase (reference timeframe: 31.05 – 31.10.2021).
Additional details are taken into consideration:
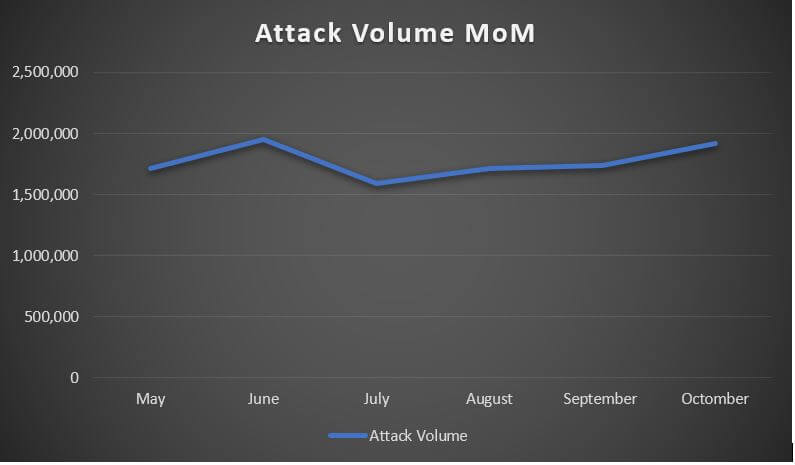
- Attack volume fluctuation (MoM) – computed as the sum of all registered attacks within the reference interval:
- May: 1,709,263 (no. of detections).
- June: 1,947,594.
- July: 1,593,593.
- August: 1,717,087.
- September: 1,735,556.
- October: 1,915,572.
2. Variation counter:
- May – June: 13.94% increase.
- June – July: 18,17% decrease.
- July – August: 7.74% increase.
- August – September: 1.07% increase.
- September – October: 10.37% increase.
From a statistical point of view, given the surge in volume, we ought to have more cases of data breaches, illegal data exfiltration, and ransomware-type activity. However, Heimdal™’s assessment proves the exact opposite – fewer odds of impact, despite visible volumetric growth. To understand the reasoning behind this statement, we shall deep-dive into the methodology our team has applied in this case study.
Risk assessment methodology & Results
To compute the overall, MoM risk score, we have factored in the following information: the total number of malicious encryption attempts per scrutinized month (May – October), total no. of positive Antivirus detections per scrutinized month (same timeframe), total no. of confirmed brute-force attempts per scrutinized month (same timeframe), total no. of DNS-delivered attacks per scrutinized month (same timeframe), and the total no. of malicious-labeled email per scrutinized month (same timeframe).
The obtained values would be multiplied with its corresponding probability rate, the result being divided by the max threshold value of the attack thought to have the highest success probability (i.e. ransomware). Risk results are expressed as quantiles.
Below, we have redacted our risk assessment scores (RA) for each month.
|
Month |
RA Score |
| May | 296 |
| June | 353 |
| July | 376 |
| August | 429 |
| September | 427 |
| October | 342 |
See the graph below to review the MoM variation of RA scores.
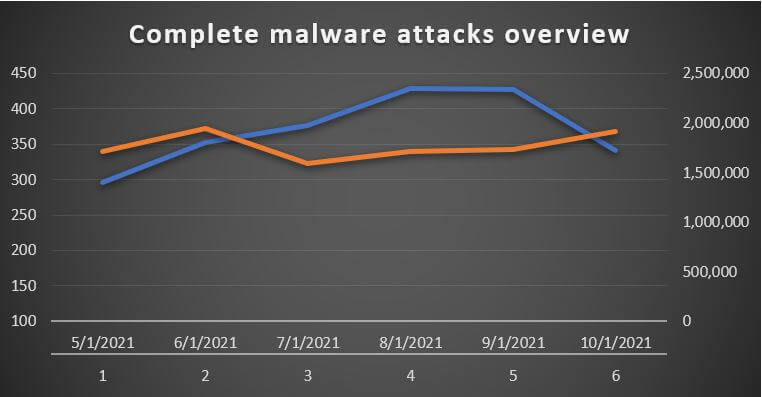
As you see from the above graph, according to Heimdal™ detection telemetry, the risk score registered a steady rise in the May-August timeframe. The score plateaued in the August-September timeframe with a distinguishable (and steady) decrease in September and October.
The steady decline in risk score is more than observable and, as mentioned before, takes place in the context of an ‘across-the-board’ volumetric increase. These numbers have been redacted in the table below.
|
Month |
Attack volume |
| May | 1,709,263 |
| June | 1,947,594 |
| July | 1,593,593 |
| August | 1,717,087 |
| September | 1,735,556 |
| October | 1,915,572 |
….and MoM variations are as follows:
The decline in attack success vs. attack volume becomes even more visible when the two graphs overlap (see figure below).
With this information on the table, we can make the following inferences:
- EDR-type countermeasures have attenuated the efficiency of the average attack.
- The existing threat-hunting methodology based on seek-and-destroy techniques has rendered most of these attacks useless.
- Attackers may be attempting to probe defenses with attacks that have fewer chances of success.
Moving Beyond Recorded Data
The data gathered and curated by Heimdal™ Security proves, beyond a shadow of a doubt, that the defender has slowly begun to win precious ground when faced with attackers. Despite the large volume of ransomware, DNS, AV, email, and BFA attacks, the odds have dramatically decreased if we compare them to those recorded.
However, we should also take into account the fact that a large number of attacks may just be a part of a larger, defense-probing scheme, orchestrated by one or more threat groups. Evidently, the telemetry supplied by Heimdal™ Security should be taken with the proverbial grain of salt – just because the defenses hold up, for now, it doesn’t mean that we should abandon our stand. To that end, before we conclude this article, let’s talk about some additional cybersecurity countermeasures you may want to implement in order to further decrease the risk of a successful attack:
- Email attack vector – employ additional spam filters, configure fraud prevention systems, and deploy Microsoft 365 protection.
- DNS attack vector – traffic-filtering solutions are the best approaches to DNS-delivered malware. Heimdal™ Security’s Threat Prevention – Endpoint is the optimal solution for sanitizing DNS, HTTP, and HTTPS traffic, and severing connections to Command & Control servers.
- Brute-force attack – timing rule on credential input, rules to timeout the session on too many incorrect inputs.
- Ransomware – DNS traffic-filter, up-to-date antivirus with a ransomware encryption protection module.
As always, stay safe, avoid malicious websites or links, and don’t forget to subscribe to Heimdal™’s newsletter for more awesome news. If you enjoyed this article, because we know that you surely did, don’t forget to follow us on Linkedin, Twitter, Youtube, or Instagram to never miss a thing we post.


 Network Security
 Vulnerability Management
 Privileged Access Management
 Endpoint Security
 Threat Hunting
 Unified Endpoint Management
 Email & Collaboration Security


