 Network Security
 Vulnerability Management
 Privileged Access Management
 Endpoint Security
 Threat Hunting
 Unified Endpoint Management
 Email & Collaboration Security


Contents:
The HTTP Archive format, also known as HAR, is a JavaScript Object Notation (JSON)-formatted archive file containing all information about a browser’s interactions with a page, such as tracked webpages, response times, and web browser version. HAR files also store metadata, such as the HAR format version and the creator of the file.
The common extension for these files is .har.
A HAR file is used in the first place for discovering performance issues, such as bottlenecks and slow load times, and page rendering problems. This file, frequently used by developers and security researchers to analyze and detect vulnerabilities, supervise every resource loaded by the browser together with timing information for each resource.
Several HTTP-related Tools such as Electron HAR, HttpWatch, HTTP Toolkit can export HAR files but are usually exported by web browsers.
The majority of browsers support the format including, Apple Safari, Microsoft Edge and Internet Explorer, Mozilla Firefox, and Google Chrome.
How to Generate or Open HAR Files
Depending on which browser you are using, there are a few ways to generate a HAR file. Users can generate & open HAR files on Google Chrome, Firefox, or any other browser, but there are some steps they need to follow. Also, it is important to remember that the HAR file is specific for each URL.
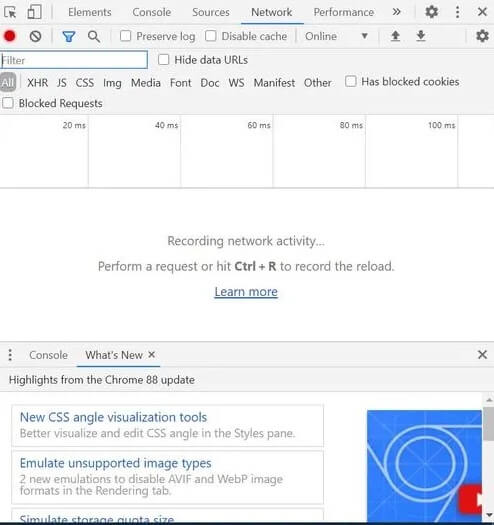
Generate HAR file on Google Chrome Browser
- Open Chrome browser and the webpage that needs to be analyzed.
- Open Developer Tools by clicking on three dots at the top right
- Select Developer Tool or you can use the CTRL+Shift+I shortcut on Windows
- Select Network tab
- Click on the small red button on the left side of the menu pane. If the button is greyed then that means it is already recording
- To avoid confusion you can delete log records kept on the browser by clicking ‘Clear icon’
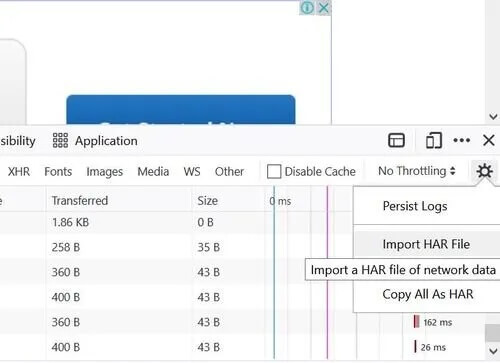
- After recording the event you can right-click and select “Save as HAR file.”
Generate HAR file on Firefox Browser
- Open Chrome browser and the webpage that needs to be analyzed.
- Open the Developer tool by clicking on three horizontal parallel lines on the top-right of the browser. Select Developer>Network
- The Developer Tools will open and can be accessed from the bottom of Firefox. Click on the Network tab
- Firefox will automatically start recording the event. You can reproduce the issue while the browser is recording
- Once done you can access the HAR file in the Developer Network Panel.
- Go to the File column and Right Click “Save all as HAR> Save the file.”
Analyzing the HAR file
Inside a HAR file, there will be several timing components that can be seen in numerous distinct ways – from the browser, using HAR Viewer, or using a website speed test tool.
All of these methods give a visual representation of how much time it is taking each resource to load. With this information, we can analyze where there is potential to decrease page loading bottlenecks and increase site speed. Usual things to pay attention to when analyzing a HAR file include resources not being cached, resources with the longest load time, and long DNS lookup times.
- DNS Lookups. DNS lookup times can vary greatly among ISPs, geographic locations, and DNS managers. Nevertheless, if you have many resources being loaded from third-party websites, this can increase the DNS lookup time for these resources thus decreasing the overall speed of your site. Consider moving items to your server or CDNs rather than loading from third parties.
- Longest load time items. The page items with the longest load time of the largest potential for speeding up your load time. The plan of action for speeding up an object will be determined by its nature. Load time of static files may be reduced through aggregation, compression, and judicious elimination of unutilized elements. And although most developers like to focus on improving the efficiency of the server-side code, typically the payback for most websites is low. If your website is a candidate for improving server-side efficiency you will see it in your HAR file.
- Items not being cached. If you reload your web page, your static objects should not be reloaded. Doing this will have an effect on page loading time as the browser must solicit all of the same resources every time the user revisits the page.
In the case that you need to send a HAR file to someone for analysis, this can easily be done from within the browser with the processes mentioned above.
A HAR file includes plenty of valuable information and data for determining where you can improve website performance. It is really easy to access HAR data due to the capacity to see it directly from the browser or on a speed website.


As a Senior Content Writer and Video Content Creator specializing in cybersecurity, I leverage digital media to unravel and clarify complex cybersecurity concepts and emerging trends. With my extensive knowledge in the field, I create content that engages a diverse audience, from cybersecurity novices to experienced experts. My approach is to create a nexus of understanding, taking technical security topics and transforming them into accessible, relatable knowledge for anyone interested in strengthening their security posture.


