


 Network Security
 Vulnerability Management
 Privileged Access Management
  Endpoint Security
 Threat Hunting
 Unified Endpoint Management
 Email & Collaboration Security


Contents:
Vulnerability and patch management are vital cogs in an organization’s cyber-hygiene plan. According to a recent Verizon cyber-safety report, more than 40% of all data breaches recorded in 2022 stem from unpatched (i.e. vulnerable) Internet-facing applications. Moreover, the rate of attack specifically targeting application coding bugs have increased by 15% over the past five years. The risk factor can increase even more, considering the average app’s reliance on APIs, as well as the technical complexity rate associated with creating, implementing, rescaling, and maintaining new and existing software.
For this reason, it’s of the utmost importance to gauge the health of your patch and vulnerability management workflows, adjusting on the go. How do you know if your strategy is effective? By applying a system of KPIs and adhering to it. In this article, we’re going to take a closer look at the most relevant KPI examples for patch and vulnerability management, how to apply them to your business, and, of course, how to present them to your stakeholders and business partners. Enjoy!
Most Important KPI Examples for Patch and Vulnerability Management
Patching Rate
This Key Performance Indicator reflects the total number of patches (e.g. OS-specific, 3rd party, UX/UI-related, proprietary, security, coldfix, etc.) deployed within a certain timeframe, which can be anywhere from a couple of hours to weeks, months, or even years, depending on the level of granularity chosen by the process owner or agreed upon with the rest of the stakeholders.
This KPI can also be made to reflect the median number of hours spent on patching or patch management-related tasks. Here’s how you can present this KPI in your next board meeting. Let’s take a real-life example; according to Computer Weekly article, enterprises will spend up to $1 million and 18,000 hours per year on patching alone. Do bear in mind that these numbers were computed by analyzing data from over 3,000 businesses.
Average Open vs Closed Vulnerabilities Based on Severity Rate
Another great KPI that you can leverage is open vs. solved bugs. What’s that about? Every responsible sysadmin knows that some types of vulnerabilities cannot be mended on spot for various reasons (e.g., the developer failed to release a functional patch, pre-deployment testing revealed compatibility issues, deployment failed due to unexpected errors, etc.).
Now, regardless of reason, the vulnerability will change status from “solved” to “open”. In other words, it’s out there for the taking. In keeping up with your reporting, a good measure of how effective your patch and vulnerability management workflows are, you can leverage the average vs closed vulnerabilities KPI. The timeframe is a question of choice; however, I would suggest doing this on a weekly basis in order to have a clearer picture at the end of the month.
For additional nuance, you can cross-reference the average open vs solved vulnerabilities indicator against the severity score associated with each type of vulnerability. Here’s how this KPI would look on paper – at the end of the reporting period, say the end of February, or beginning of March, we have managed to patch, on average, 50 bugs, with 3 vulnerabilities left unsolved. However, the open vulnerabilities had an average severity score of none-to-medium (i.e., the typical severity score sheet has the following levels – Critical, High, Medium, Low, and None) whereas the solved vulnerabilities had an average score of medium-to-critical.
Scan Rate
This KPI shows how often you scan your assets for vulnerabilities. As far as best practices go, according to NIST the scan rate/frequency strictly depends on the global risk score and, of course, the scanner itself, however, it should be done at least once per year.
Time to Detect
TTD (i.e. Time to Detect) is KPI used to detect the average time it takes for your IT team to discover a vulnerability. Basically, TTD measures the time gap between the vulnerability’s creation and when it was detected.
Time to Resolve.
TTR (i.e. Time to Resolve) is TTR’s sequel. This KPI measures the time gap between vulnerability detection and resolution.
Business Unit Risk Score
One way of figuring out a business’s overall risk score is to calculate the vulnerability rating associated with each business unit (i.e., a department or team). So, how does this work? As we know, each department in your company is different. Obviously, this means that it carries a different risk score. For instance, a data breach occurring in Marketing may not have the impact as one in Finance. Based on this assumption, you can now calculate a baseline score based on each department’s (i.e. business unit) risk factor.
Vulnerability Maturity
This KPI keeps track of the amount of time that has passed since the official disclosure of a vulnerability. Very useful in composing hybrid KPIs. For instance, you can combine vulnerability maturity with one or more severity ratings in order to compute the overall risk score of an open vulnerability.
Average Number of Granted Exceptions
This KPI may be a little confusing. In this case, the “exceptions” part does not refer to user- or account-based permissions, but rather to open vulnerabilities that have yet to receive a resolution. In an ideal scenario, all “open” bugs are patched in a timely manner. However, in practice, sysadmins might sometimes overlook or outright forget about these vulnerabilities. This KPI will definitely help you keep track of all the unresolved bugs, deploying fixing as they become available.
Average Audit Score
The average audit may not be an official, golden standard KPI, but pretty useful in gauging the effectiveness of your patch and vulnerability management program. This indicator ingests the results of your internal and external (i.e. 3rd party) audits, computing an average score.
Patch Prioritization Based on Vulnerability Rating
Last KPI on our list is a play on my favorite patching advice – “priority makes all the difference in the world!” So, how would one make use of this KPI? Let’s assume that you must apply 10 security patches. They’re all vital, so which one should go first? First, the security patches are grouped by vulnerability rating. This will determine the order of deployment. After that, it’s just of matter of picking out the ones with the highest security score.
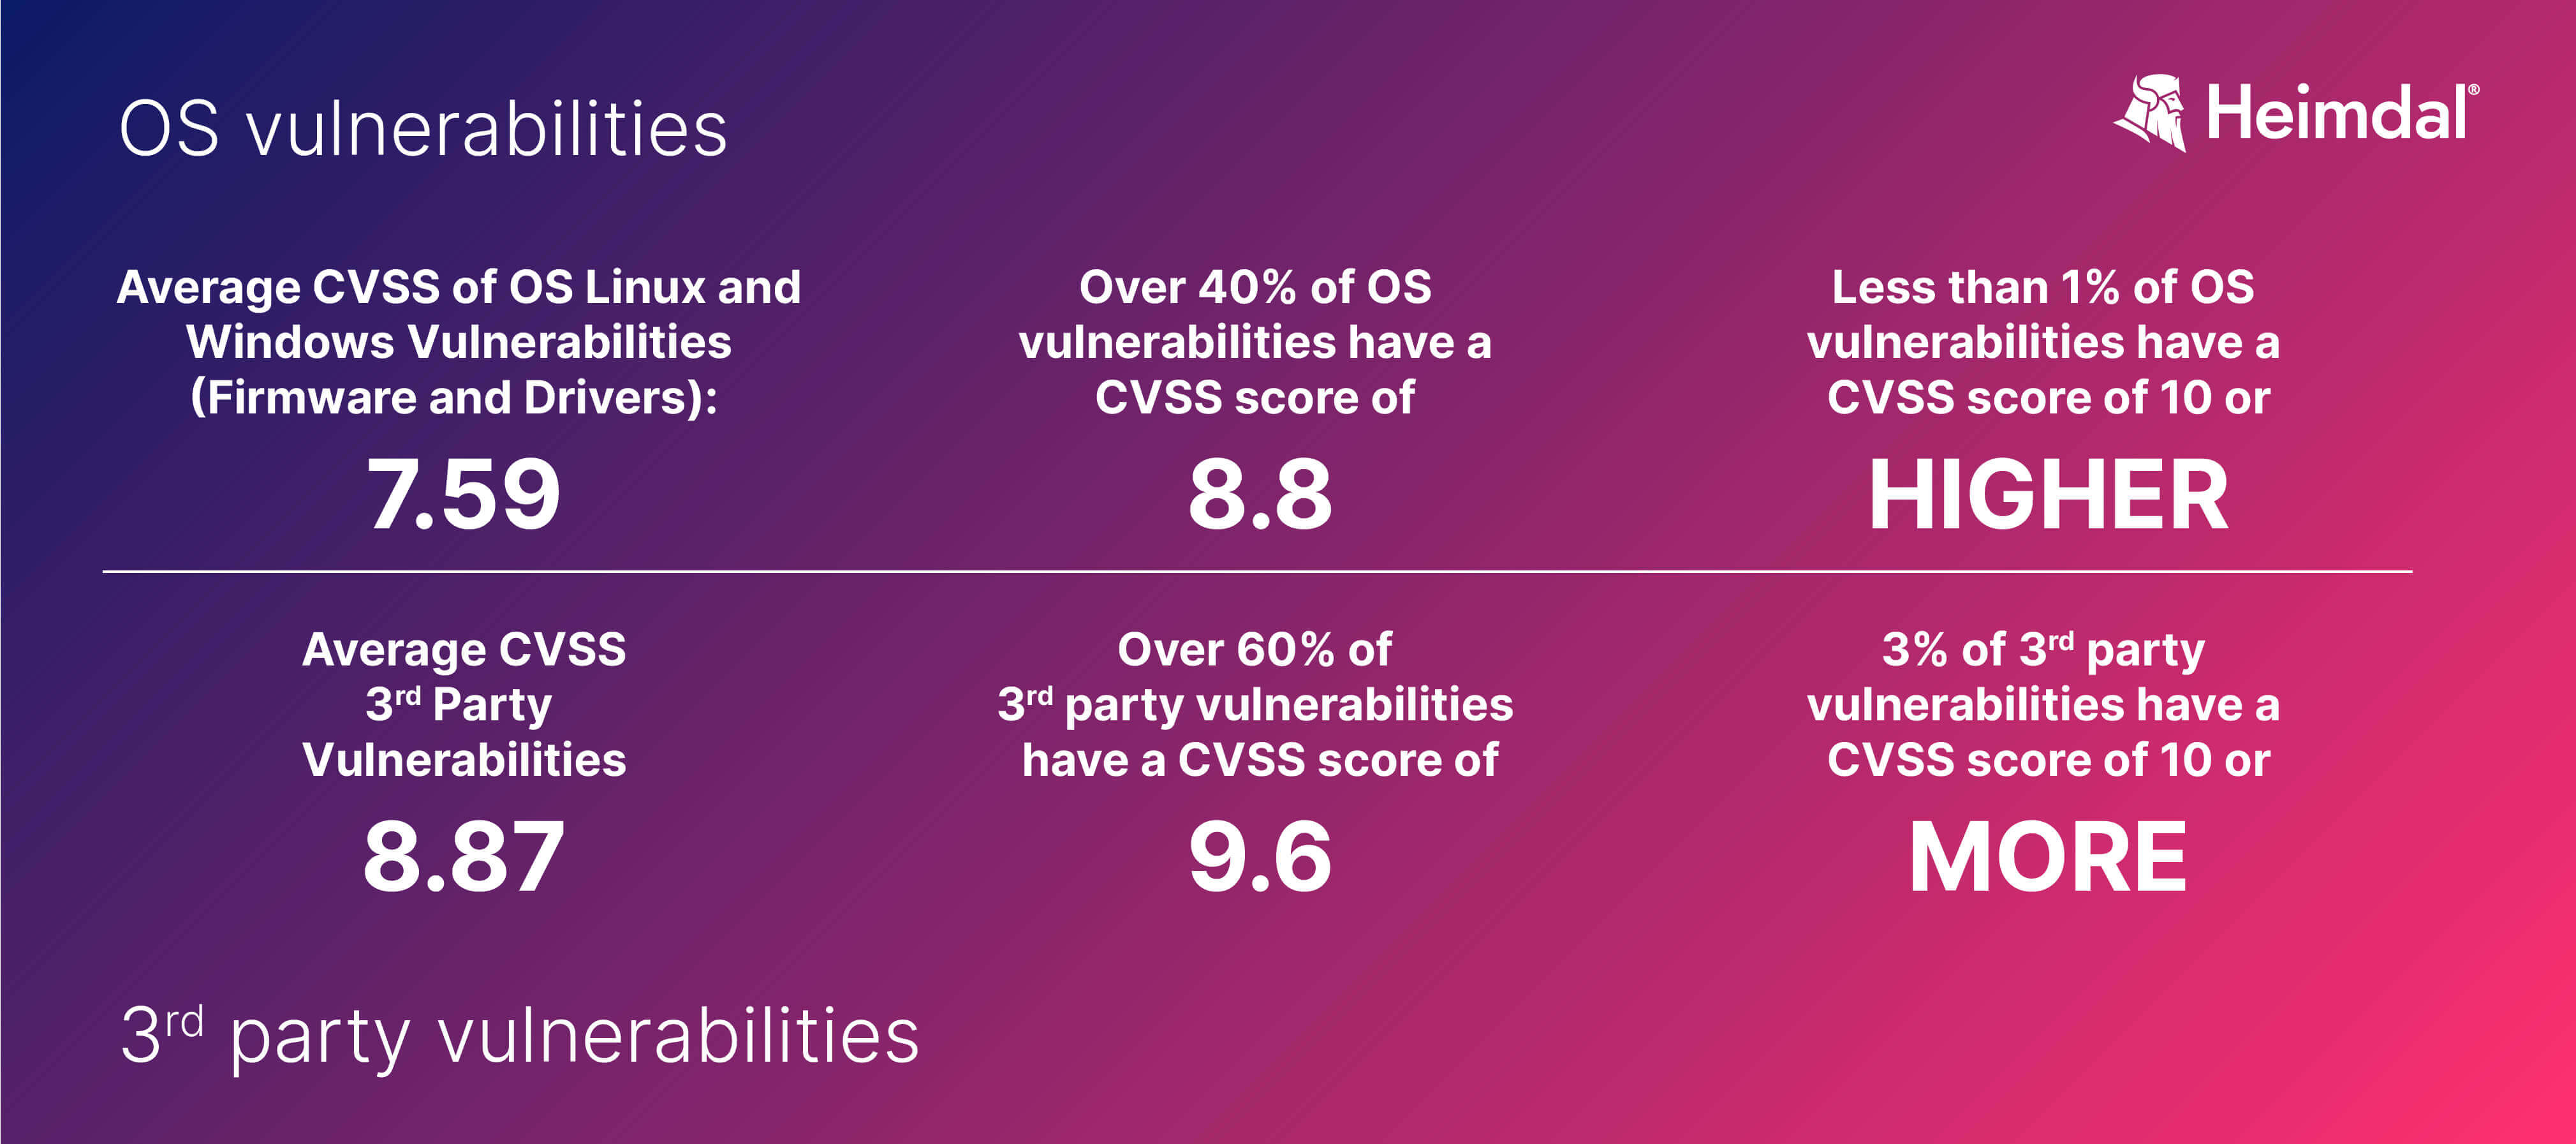
Priority can also be set depending on the nature of your patches. For instance, however counterintuitive it may sound or feel, third-party patches should be deployed before OS patches. A Heimdal® ancillary study has found out that the average CVSS (i.e. risk score) attributed to third-party vulnerabilities is 8.87 i.e. High) while Operating System vulnerabilities have an average CVSS of 7.59 (i.e. Medium to High). Furthermore, based on the same study, we have discovered that approximately 3% of the investigated third-party vulnerabilities have a CVSS score of 10 or higher (i.e. Critical), but only 1% of OS vulnerabilities belong into the 10% range. The results of our investigation can be found below.
Additional Patch & Vulnerability Management Tips
This concludes my article on the most important KPI examples for patch and vulnerability management. Before I scoot, here’s a short list of dos and don’ts that will help you jumpstart or improve your patch management game.
- Don’t fear the reaper..cussions. There’s no magic recipe for patching, which means something’s bound to happen at any time (e.g., unexpected patch failure, connection errors, no mobile control, insufficient privileges, failure to meet regulatory compliance requirements, etc.). Ensure that your backups are viable if you need to roll back to a previous version.
- Vulnerability scanning frequency. Don’t forget about your vulnerability scanning schedule. The best practice dictates that scanning should occur at least once per year.
- Automated patching. Smaller organizations tend to rely on manual patching in order to deploy all relevant improvement-carrying packages. However, things tend to change a bit when you’re in the shoes of an IT admin catering to the needs of hundreds of users. The best way around this issue is, of course, automated patching. If configured correctly, an automatic patching solution can ensure timely (and correct) deployment and a low risk of incompatibility. Heimdal®’s Patch & Asset Management can aid you in quickly distributing your patches, regardless if they are OS-specific, 3rd party, proprietary, or UX/UI-oriented.
If you liked this article, follow us on LinkedIn, Twitter, Facebook, and YouTube for more cybersecurity news and topics.


